
Teacher shortages dominate headlines, but the scale and shape of the problem varies widely from one state to the next. Drawing on a decade of federal education, workforce and degree-completion data, American College of Education (ACE) analyzed three signals across all 50 states changes in pupil-to-teacher ratios, new-teacher production rates, and the gap between hiring and enrollment growth. The result is a state-by-state view of where classroom pressure is sharpest and which credential types face the biggest gaps in new graduates.
Key Takeaways
- Louisiana ranks first for teacher pipeline pressure of any state in the country, with a pupil-to-teacher ratio that rose 2.6 points over the past decade and one of the lowest education graduate production rates nationally.
- Secondary education produces just nine new graduates for every 1,000 current teachers, roughly three times fewer than elementary education (28.5) and more than four times fewer than special education (38.7), making it the thinnest point in the entire teacher pipeline.
- Texas produces one new education graduate for roughly every 3,300 students enrolled, the lowest rate of any state in the country, while California, the most populous state, produces only one for every 2,300.
- The country produces nearly 10,000 fewer elementary education graduates per year than it did a decade ago, dropping from 49,717 in 2014 to 39,683 in 2023, with secondary education losing another 2,366 graduates per year over the same period.
- In Louisiana, Alabama, Nevada, Oklahoma, Ohio and Nebraska, class sizes grew over the past decade, while education degree production simultaneously declined.
- New York ranks strongest on the composite pipeline-pressure score, with class sizes shrinking by 2.2 points and teacher hiring outpacing student enrollment growth by 20.2% over the decade.
Where Teacher Pipeline Pressure Is Concentrated
Some states face steeper classroom challenges than others when it comes to keeping up with demand. The state-by-state ranking shows which places carry the heaviest combined pressure across all three indicators.
Louisiana ranked first for overall pipeline pressure among all 50 states, driven by a pupil-to-teacher ratio that climbed 2.6 points over the decade and one of the lowest degree-production rates nationally. Texas produced the fewest new education graduates relative to its student population, at roughly one for every 3,300 students enrolled. California, the most populous state in the country, followed close behind at one new graduate for every 2,300 students.
At the regional level, the West South Central division, which includes Louisiana, Texas, Oklahoma and Arkansas, carried the highest average pipeline pressure in the country. It was one of only two divisions where average class sizes grew over the decade instead of shrinking (alongside the Mountain division).
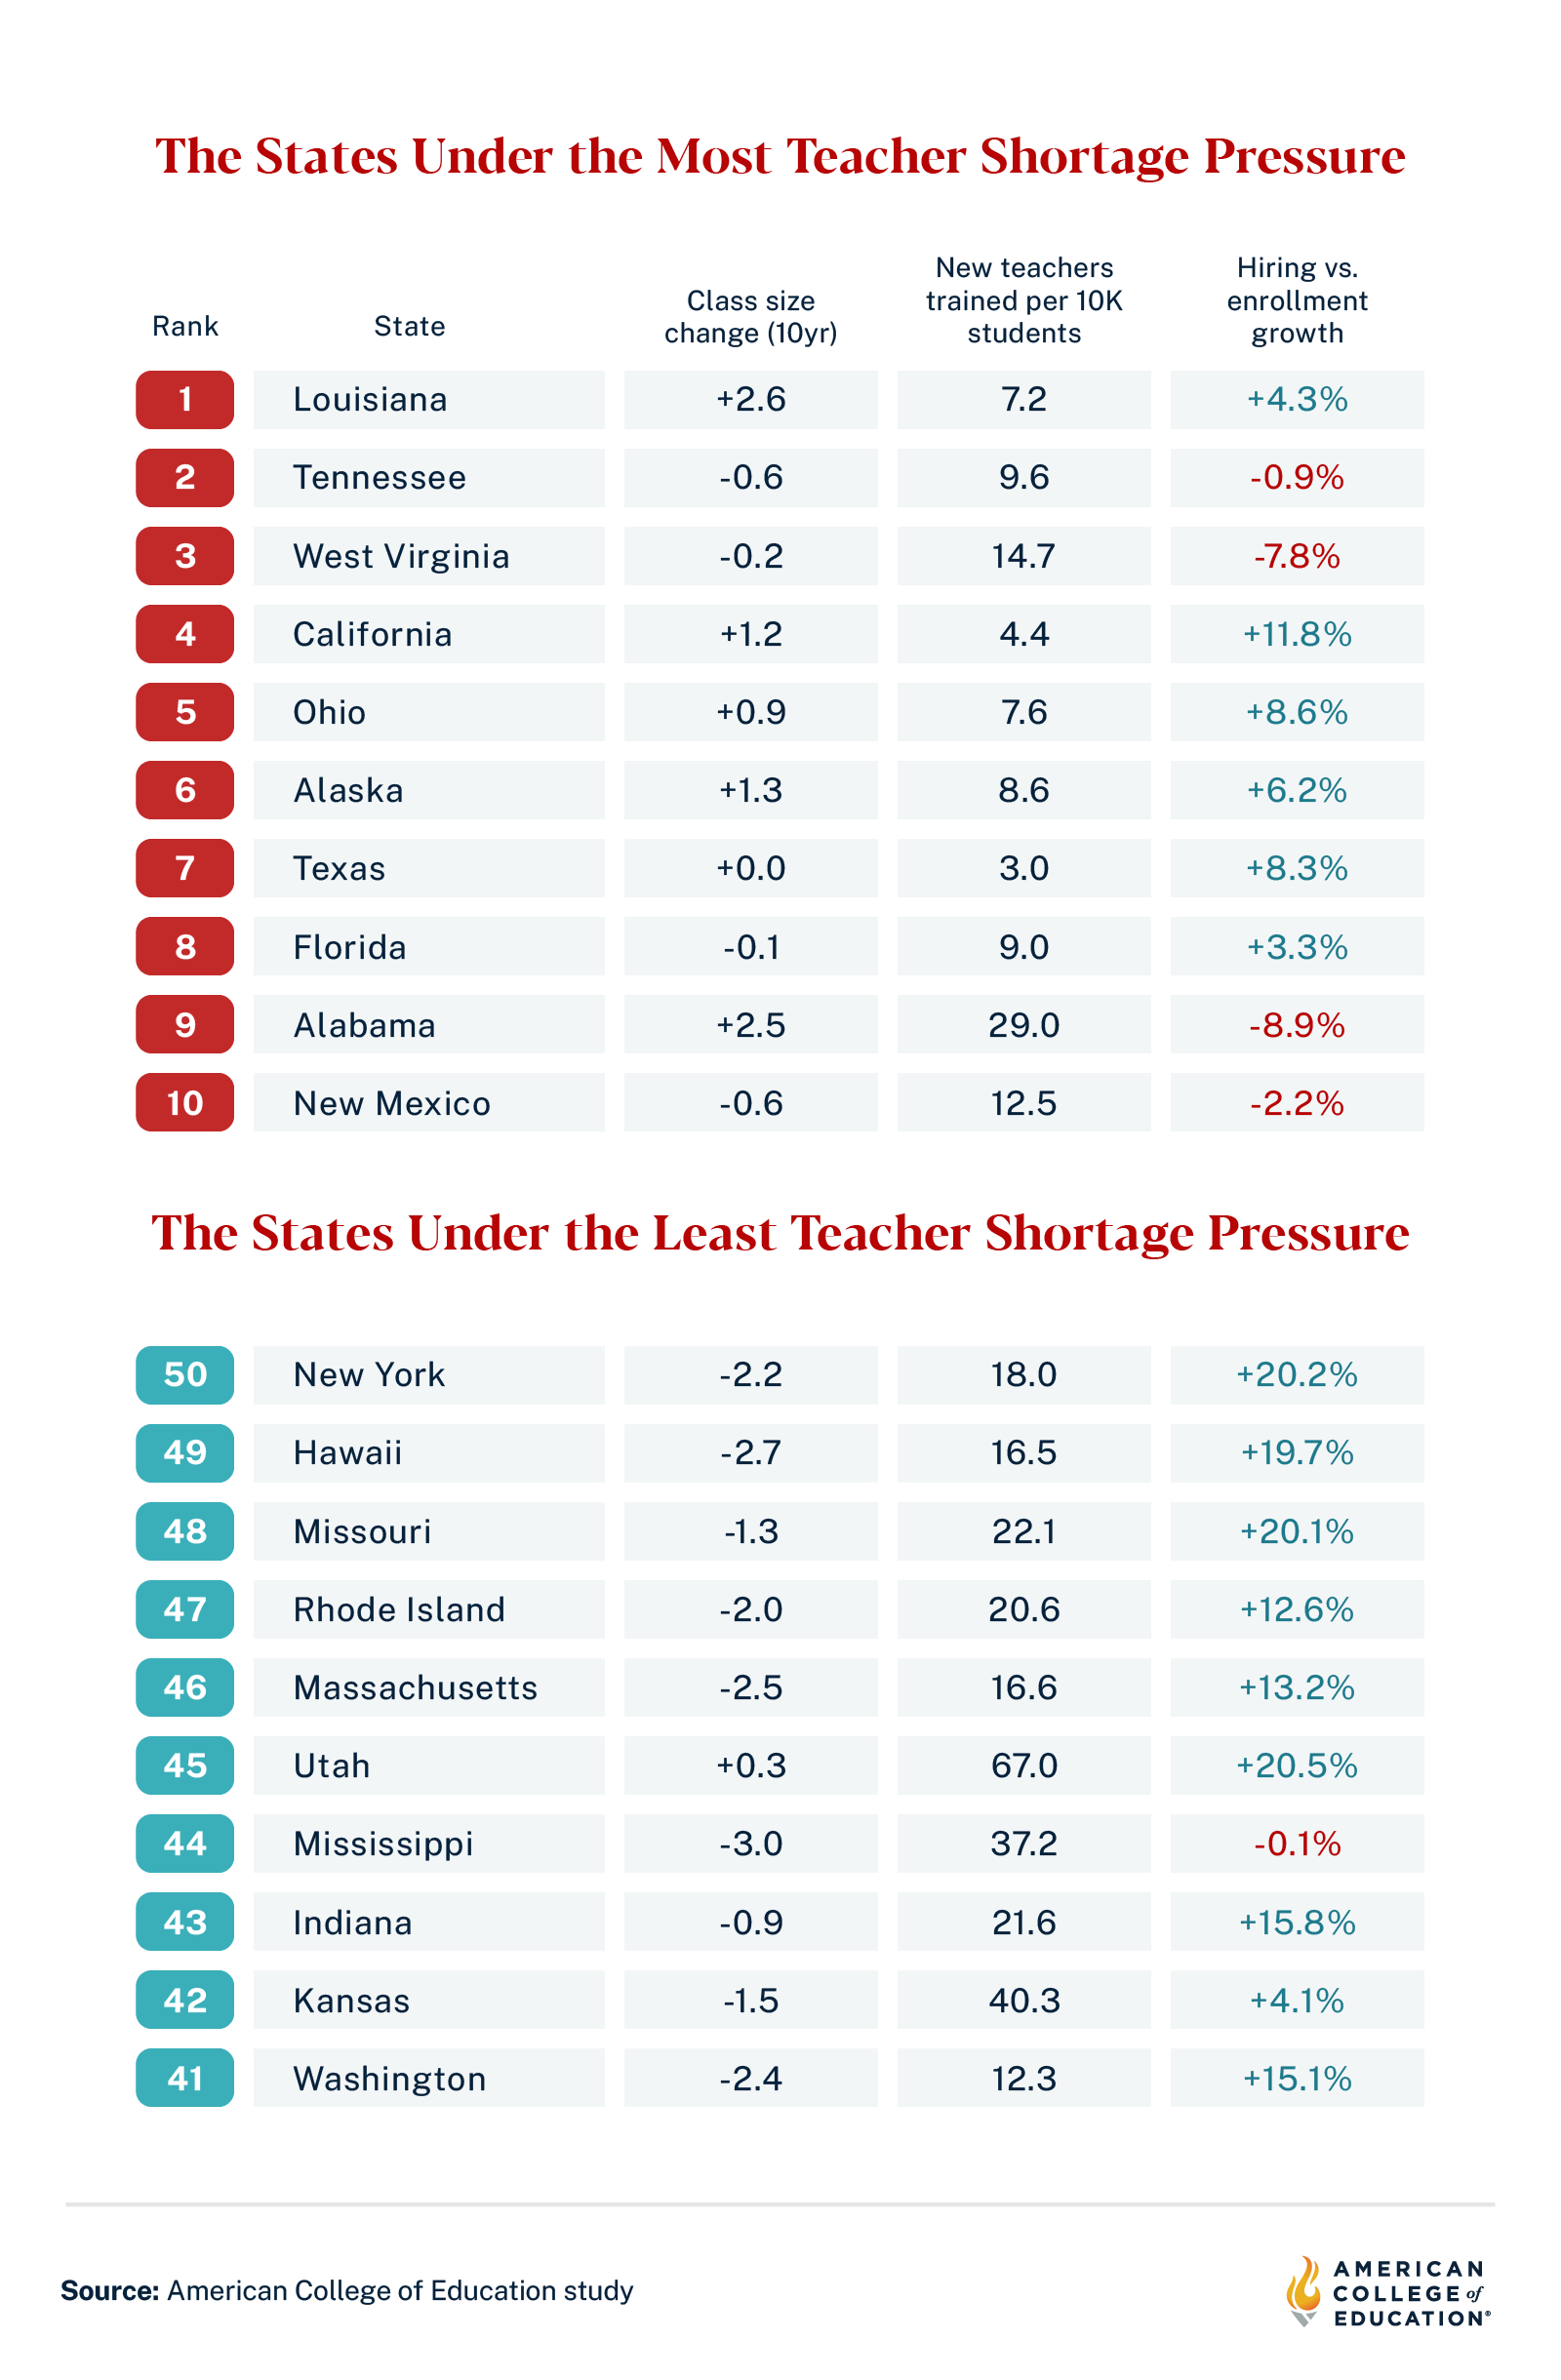
Nine of the 10 highest-pressure states sit in the south or west: Louisiana, Tennessee, West Virginia, California, Alaska, Texas, Florida, Alabama and New Mexico. No. 5 Ohio was the only exception, representing the Midwest.
Six states overall saw class sizes grow at the same time that education degree production declined:
- Louisiana (+2.6)
- Alabama (+2.5)
- Nevada (+2.4)
- Oklahoma (+1.6)
- Ohio (+0.9)
- Nebraska (+0.1)
On the other hand, New York recorded the strongest improvement signals of any state, with teacher hiring outpacing student enrollment growth by more than 20% while class sizes dropped by 2.2 points. Nine states saw hiring outpace enrollment growth by more than 15% over the decade:
- Idaho (+23.6%)
- Utah (+20.5%)
- New York (+20.2%)
- Missouri (+20.1%)
- Hawaii (+19.7%)
- Oregon (+17.8%)
- Indiana (+15.8%)
- Arizona (+15.8%)
- Washington (+15.1%)
The Credential Types Thinning the Fastest
The teacher pipeline is not shrinking at the same pace across all credential areas. Some types have stayed relatively stable while others dropped off sharply.
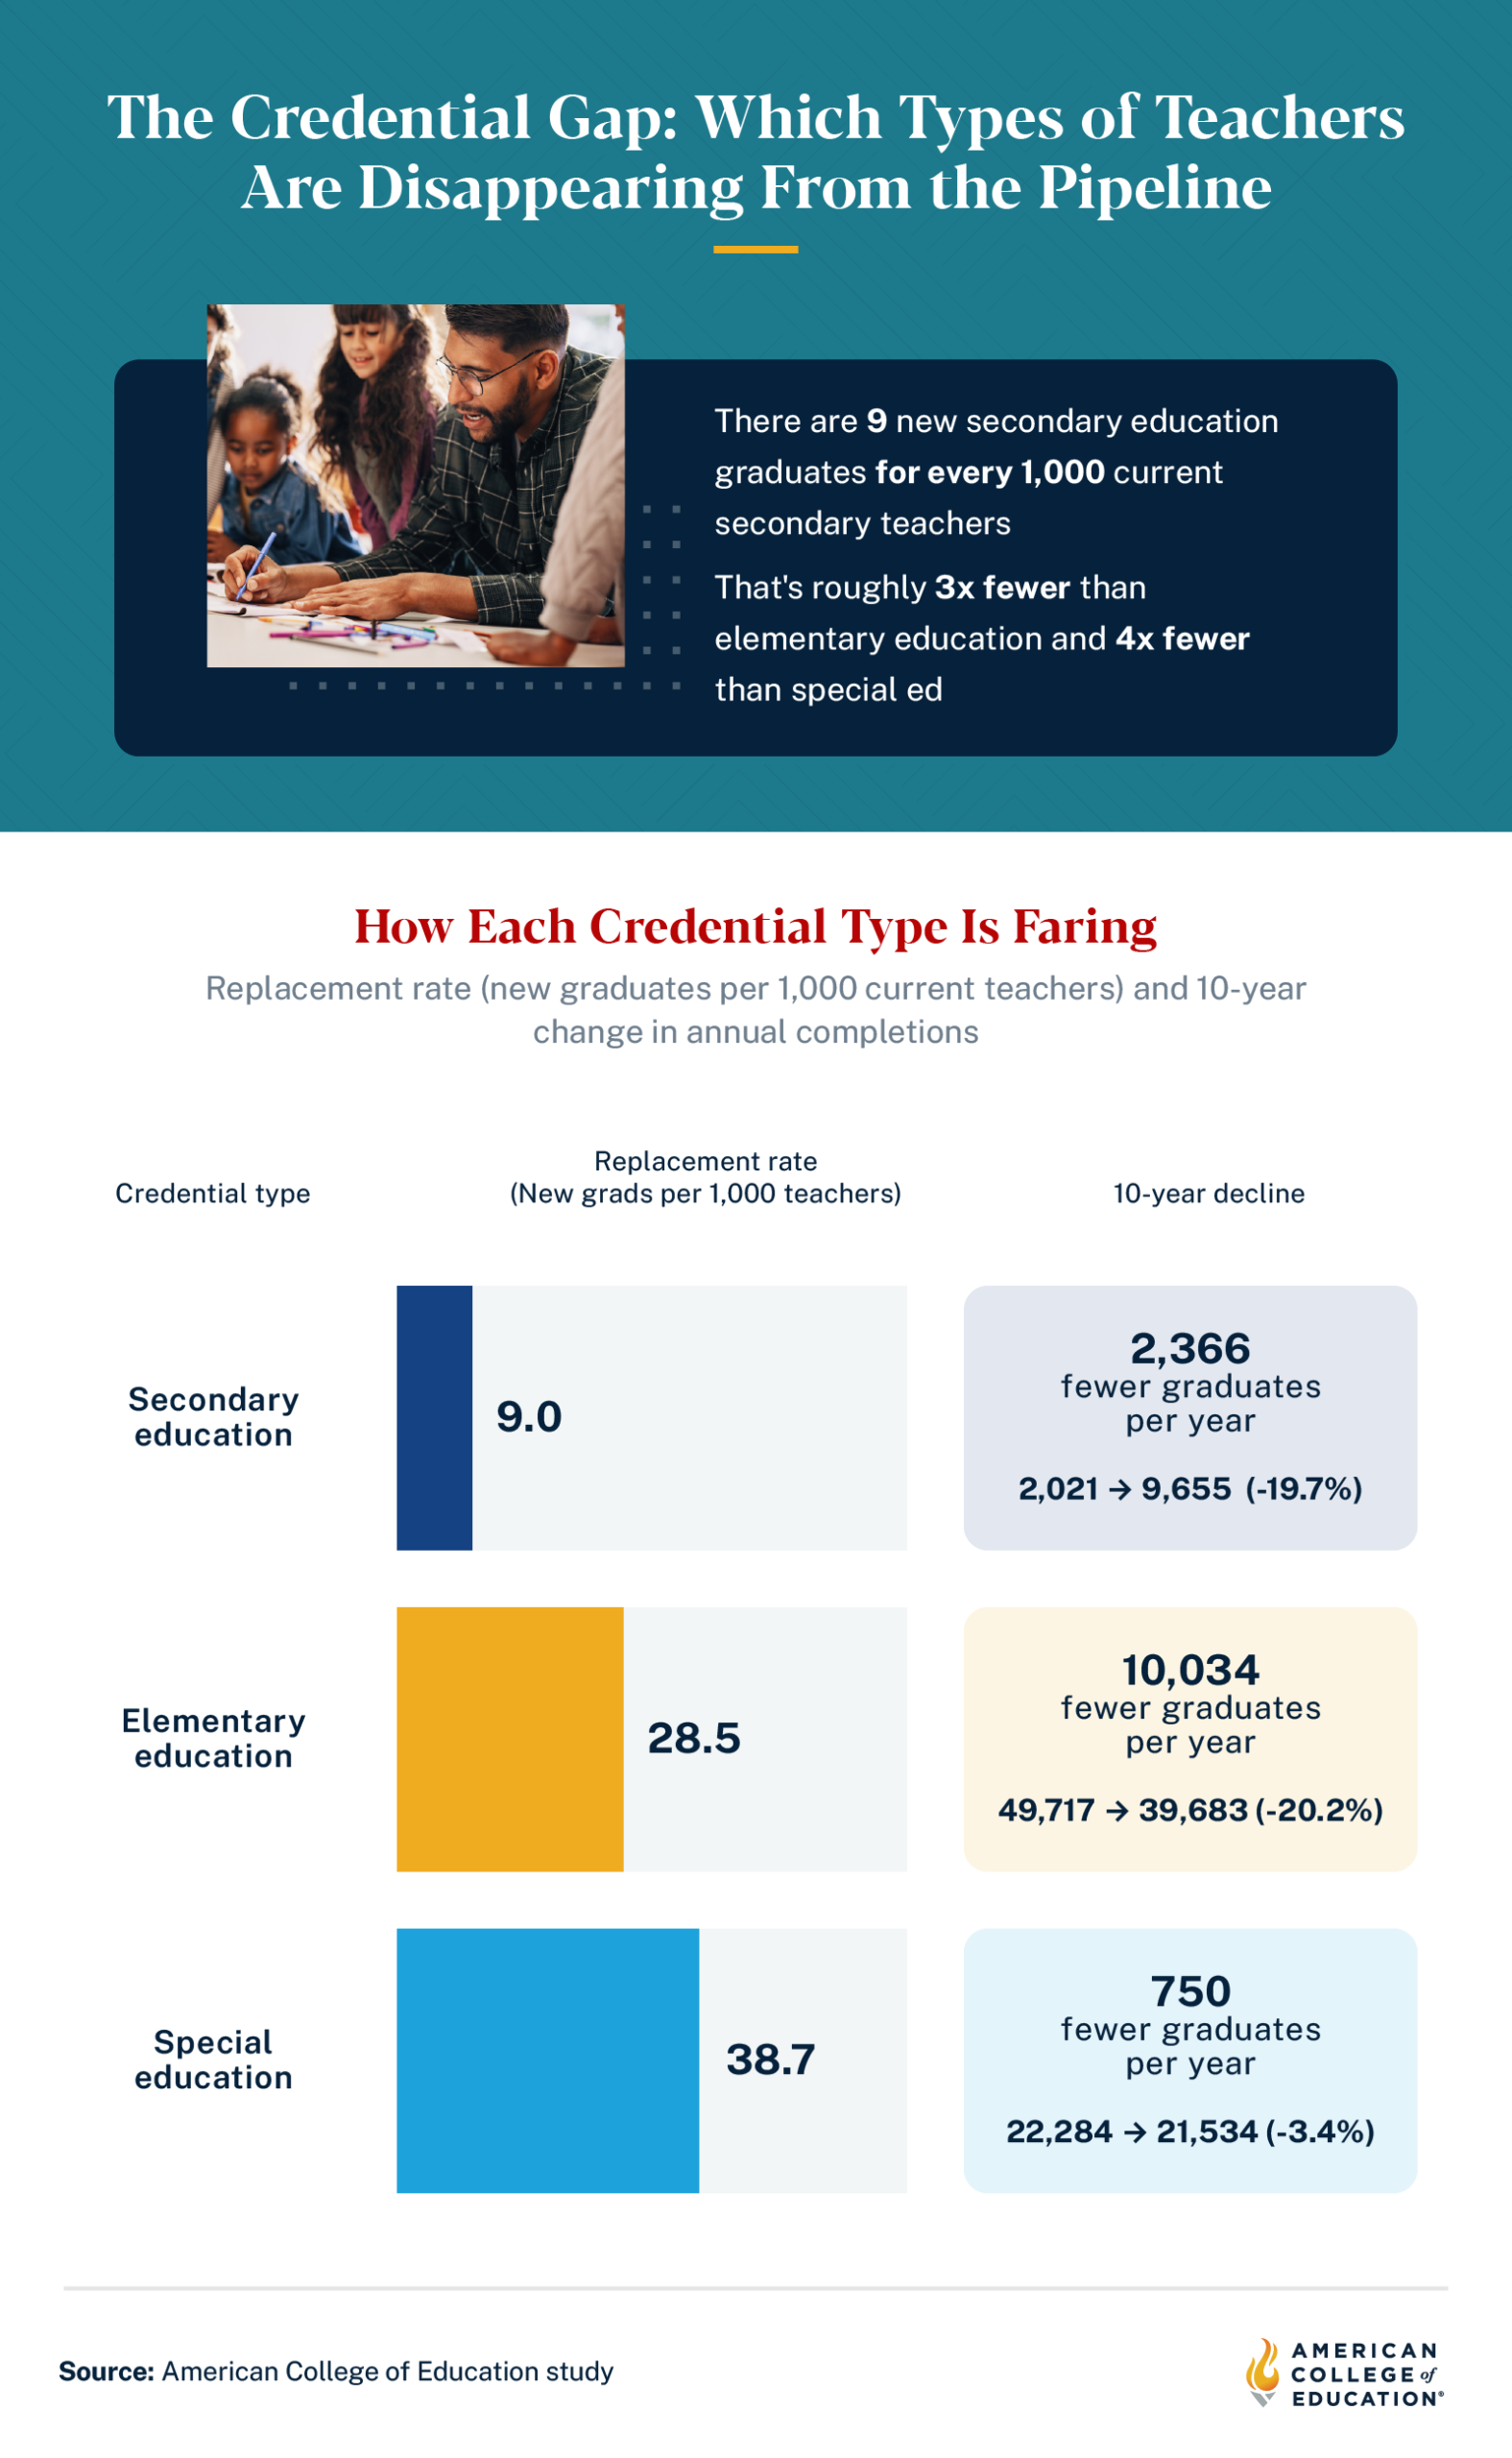
Secondary education produced just nine new graduates for every 1,000 current teachers. That rate is about three times lower than elementary education at 28.5 graduates per 1,000 teachers, and more than four times lower than special education at 38.7. Secondary completions also declined nearly 20% over the decade, falling from 12,021 to 9,655 annual graduates, or 2,366 fewer new secondary teachers entering the profession each year.
Elementary education saw the largest absolute decline in volume. The country produced around 10,000 fewer elementary education graduates in 2023 than in 2014, with annual output falling from 49,717 to 39,683. Special education held up much better by comparison, declining just 3.4% over the decade, compared with drops of roughly 20% in both elementary and secondary education.
The decline was sharpest at the entry point. Bachelor’s degree education completions fell 18.9% over the past decade, nearly twice the rate of master’s degree completions at 10.7%.
In the states facing the most pressure, secondary education has nearly vanished from the pipeline:
- Alaska produced just 29 secondary education graduates across all academic levels last year
- Texas produced only seven at the bachelor’s level
- West Virginia produced zero at the master’s level
What the Signals Mean for Schools and Educators
Teacher shortages are often discussed as a single national problem, but the data tells a much more local story. Some states improved conditions over the decade, while others face mounting pressure in classrooms, graduate pipelines and hiring.
For school districts navigating these realities, the path forward increasingly runs through partnerships. Districts in the highest-pressure states are turning to online education providers to expand their pipelines, train current staff into high-need credential areas, and create alternative routes into the profession for paraprofessionals and career changers already embedded in their communities. Programs that meet candidates where they are, geographically and financially, can help districts close the gap between the teachers they have and the teachers they need.
For adults considering a career in education or current educators weighing graduate study, the shape of the shortage matters. Knowing where new teachers are most scarce, and in which credential areas, can shape a more informed decision about where to focus.
Methodology
This analysis, conducted by Fractl on behalf of ACE, examines teacher pipeline pressure signals across all 50 U.S. states using three federal datasets. Findings are directional indicators based on proxy metrics and should not be interpreted as definitive shortage rankings. All relationships are correlational. Washington, D.C., was excluded because its profile as a single urban district is not comparable to state-level data.
Data Sources:
- NCES Common Core of Data (pupil-to-teacher ratios, teacher counts, student enrollment by state)
- IPEDS Completions (education degree completions by CIP code, award level and institution state)
- BLS Occupational Employment and Wage Statistics (teacher employment estimates by occupation and state)
Each state was ranked on three metrics (higher rank = more pressure), then averaged into a composite score:
- PTR change: Change in pupil-to-teacher ratio over the most recent decade. States with the largest increases ranked highest.
- Degree production rate: Education degree completions per 10,000 students enrolled. States producing the fewest graduates ranked highest.
- Employment gap: Percent change in teacher employment minus percent change in student enrollment over the decade. States where hiring fell furthest behind enrollment ranked highest.
New graduates per 1,000 current teachers was calculated by matching IPEDS completions by CIP code to BLS employment by corresponding SOC code. This is a proxy metric: The two systems use different classification structures,. Not all graduates enter teaching, and not all new teachers hold a traditional education degree from an in-state program.
About American College of Education
American College of Education (ACE) is an accredited, fully online college specializing in high-quality, affordable programs in education, business, healthcare and nursing. Headquartered in Indianapolis, ACE offers more than 60 innovative and engaging programs for adult students to pursue a doctorate, specialist, master’s or bachelor’s degree, along with graduate-level certificate programs.
Fair Use Statement
The information in this article may be used for noncommercial purposes only. If shared, please provide a link to this page and proper attribution to American College of Education.